This is information about the Magellan satellite’s orbit around Venus, including when during each orbit the satellite took photos of Venus’ surface.
The two main sources for this page are
First, a picture:
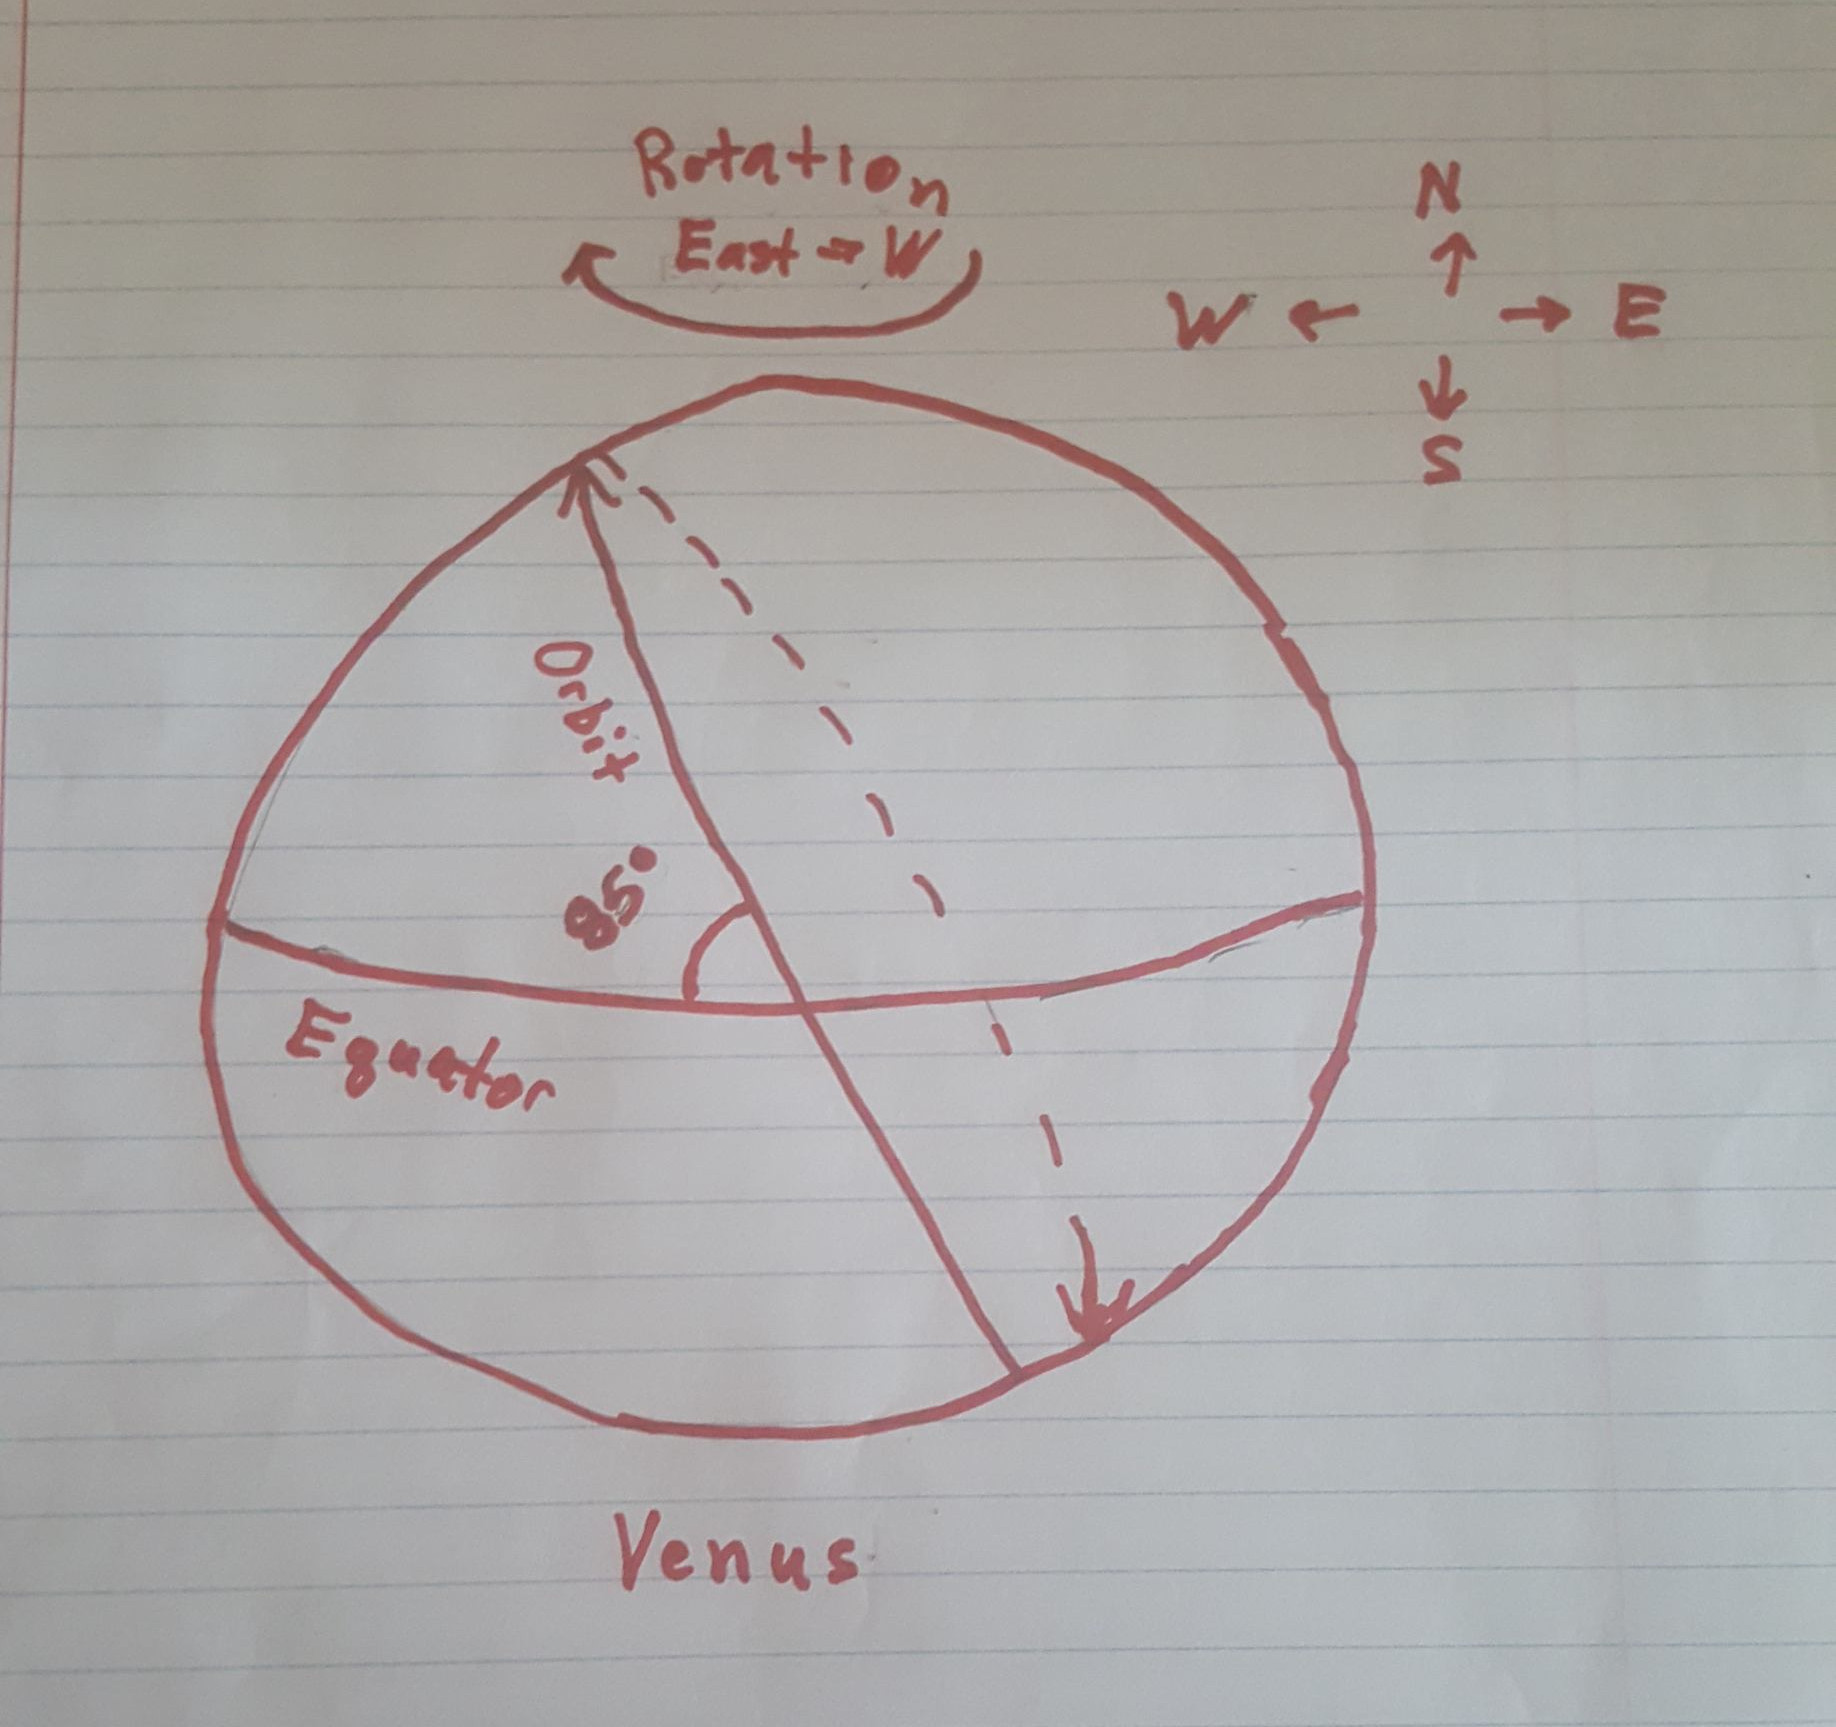
A diagram of the Magellan's orbit on Venus
When an artificial satellite orbits a body (like Magellan orbited Venus), we describe the orbit with different things, one of them being the angle of inclination. This angle describes how the satellite orbits relative to the planet’s equator and relative to the planet’s rotation. It’s the angle made between the equator line and the orbit line; for the Magellan mission it was 85°.
If the angle is between 0° and 90°, then the orbit is in the direction of the orbit. Notice how, if you were to follow the orbit with your finger (in the direction of the arrow), it moves from east to west in the same way that Venus rotates from east to west. Satellite orbits that follow the planet’s orbit are called prograde, and orbits that go against the planet’s orbit are called retrograde.
Venus is different from Earth in that it rotates from east to west. So the sun rises in the west on Venus and sets in the east, the exact opposite of how it is on Earth.
The actual photo taking (radar photos) was done as the satellite came down from north to south on Venus, the dotted line orbit shown “behind” Venus. (mgn-guide page 5) has a helpful image to display this.
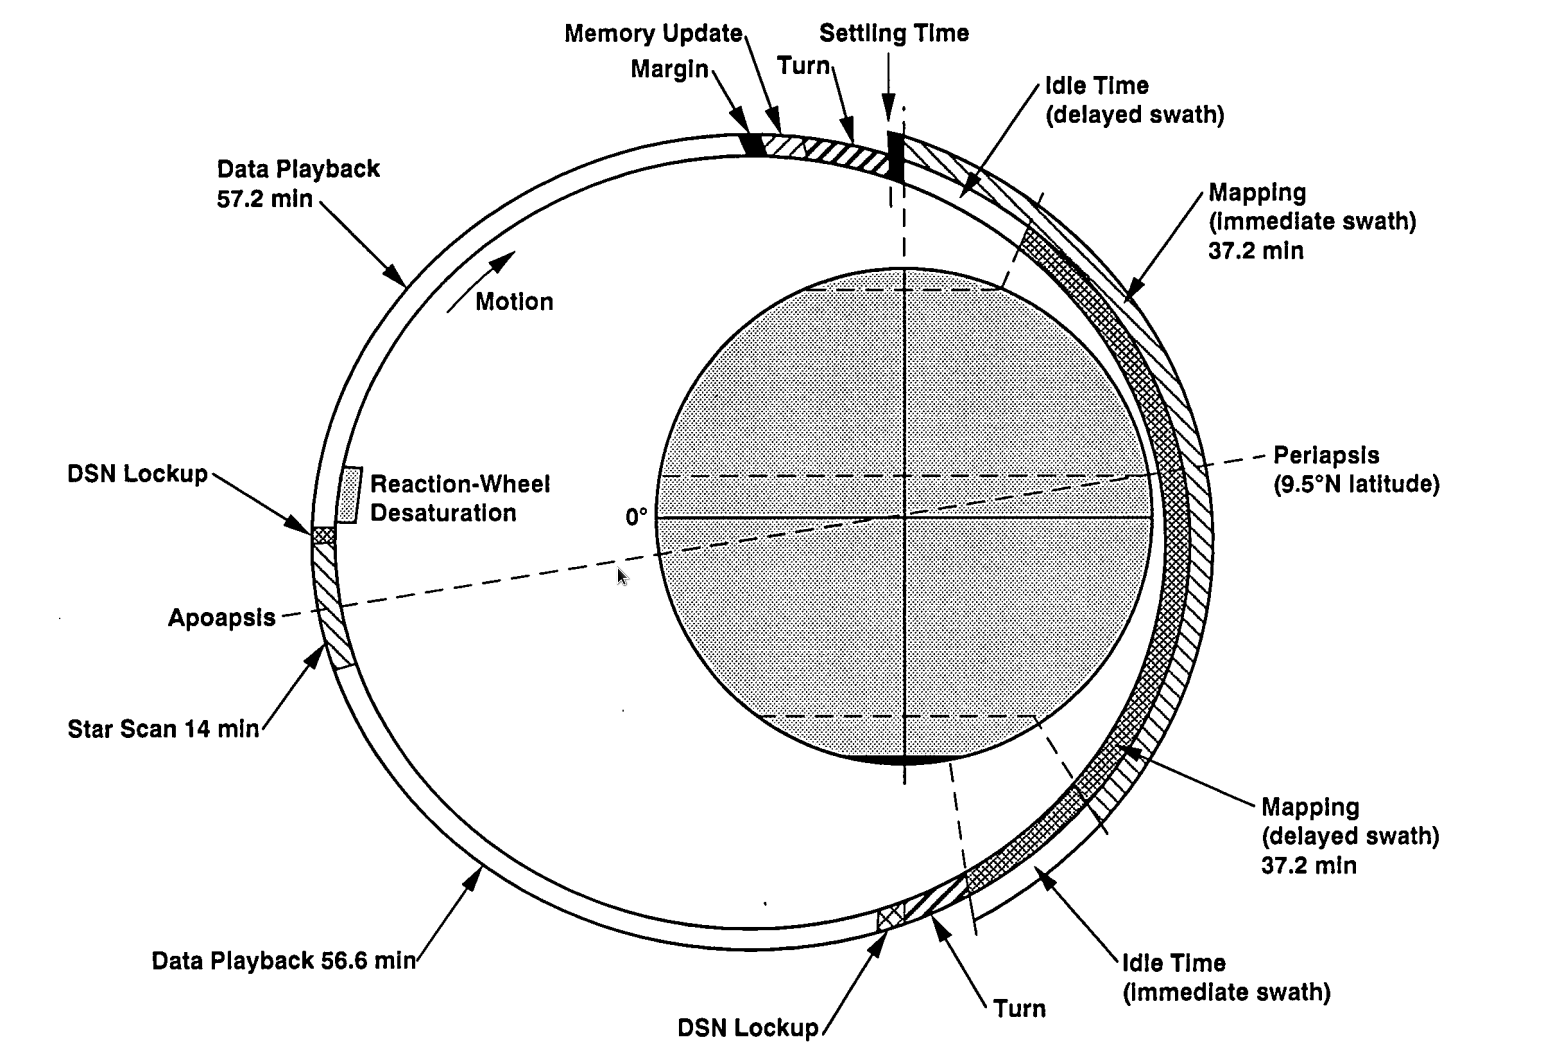
The orbit displayed as a timeline of various events which occurred during each orbit: from when the satellite took radiation "pictures" of Venus' surface, to when the satellite sent that data back to Earth. The top of the picture is North, and the bottom is South.
There’s a lot going on here, and I want to concentrate on just how and when the images of the surface were recorded, so I will remove all the arrows and things not related to just that:
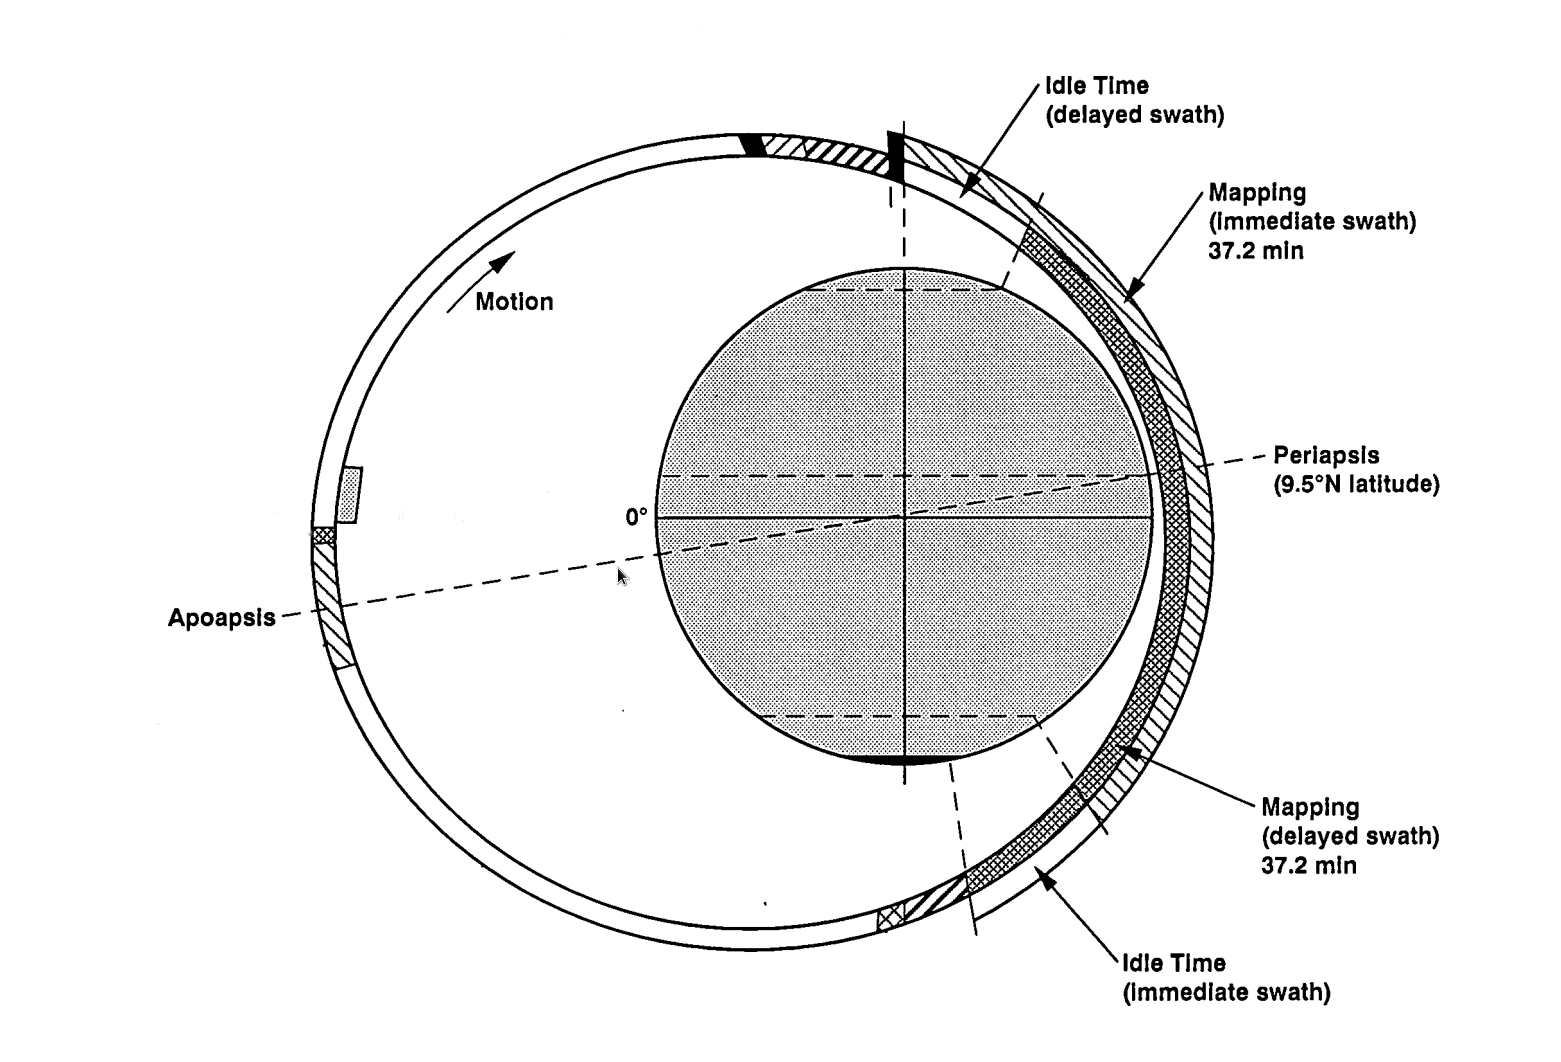
The orbit just displaying when recording starts and stops.
There are two regions of each orbit that the satellite could record: the immeidate region and the delayed region. In the immediate region, Magellan starts recording the surface as soon as it starts going travelling Southward on its orbit; the immediate region is the bar with lines going across it in the picture. In the delayed region, Magellan waits a little bit before recording the surface; the “waits a little bit” is shown by idle time in the delayed swath.
Relevant quote from (mgn-guide page 3):
Because the area of new terrain observed by the sensor in equatorial latitudes is much greater than at the poles, it is possible to map high latitudes on alternating orbits with an acceptable margin of overlap. In Cycle 1, this technique was used to reduce redundancy and maximize areal coverage. Mapping started at the north pole in each alternate orbit and continued to about 57° latitude. These swaths are termed “immediate.” In the intervening orbits, mapping started at about 70°N and extended to 74°S latitude. These swaths are “delayed.” An idle time of about 7 min occurred at the end of each immediate swath and the beginning of each delayed swath (Figure 1–3).
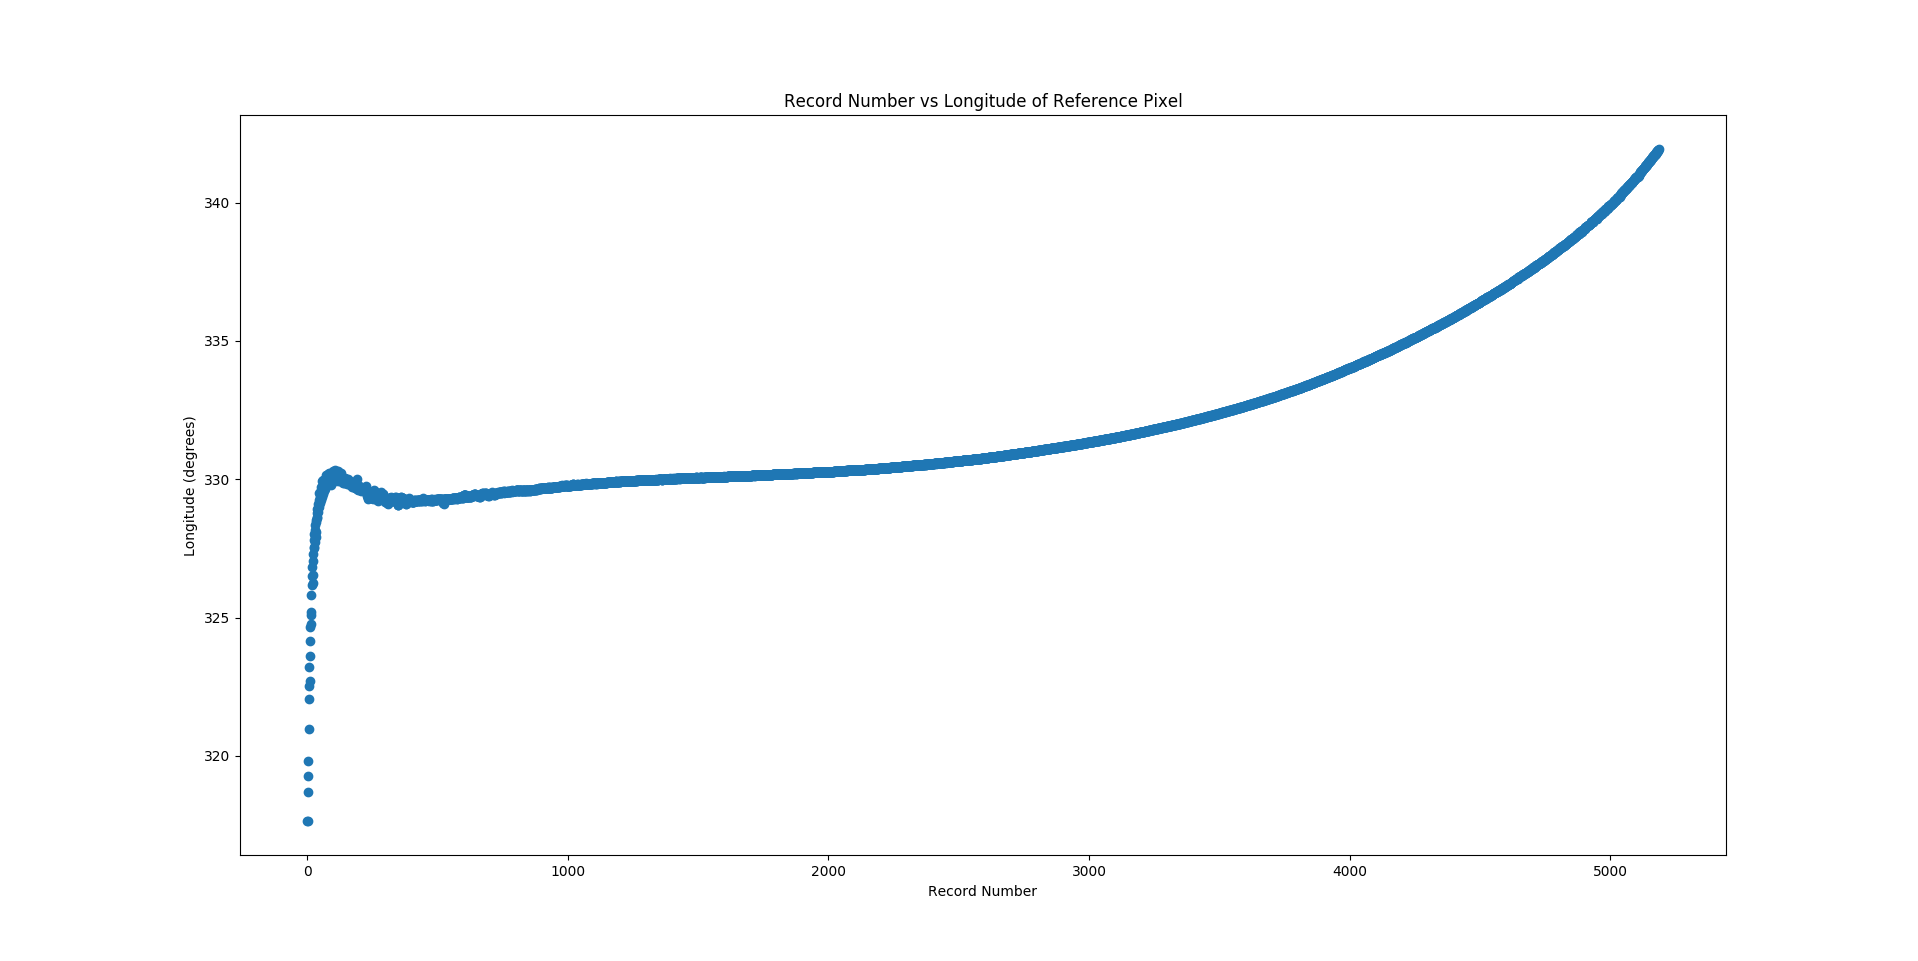
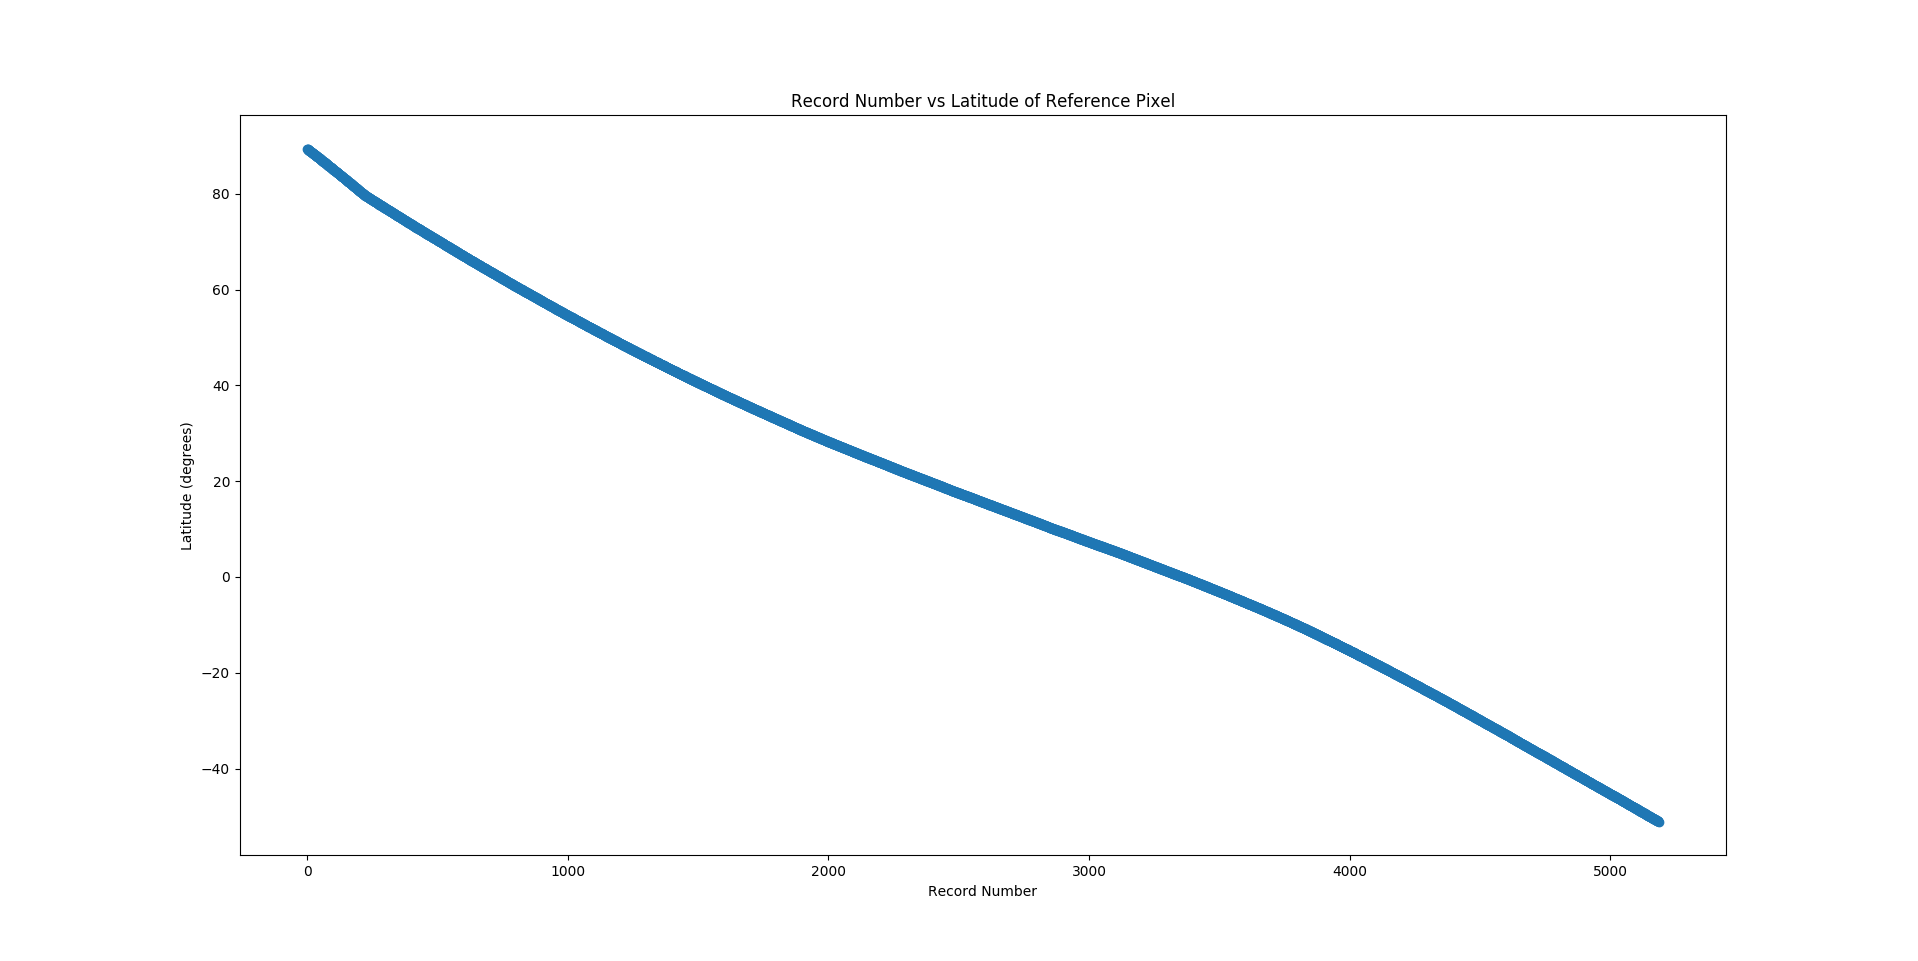
The actual data seems to support all these findings. Each noodle actually consists of a series of small pictures of Venus’ surface, with snapshots from earlier in the orbit (more North) coming first and snapshots from later in the orbit (more South) coming later. The latitude and longitude of the top-left pixel of each snapshot is recorded as metadata with each snapshot. Each of these snapshot data + metadata pairs is called an image record; below is a graph that plots the image record number (smaller means earlier in orbit) versus the latitude of the top-left pixel of the snapshot from a noodle I chose:
Graphing the longitude against the record number reveals somewhat similar results, that the satellite generally sweeps from west to east: increasing longitude. However it is not exactly as I would expect based on the hand-drawn diagram from above. I am not sure why that happens.